
Bending Cost - Does it work
Bending & Trending –ashortcut,thatmaycuttoo shortto bereliable
By Rodney Hyman, ASA LFAPI FRICS and Alexander Lopatnikov, ASA
One of the core values for a consultant or advisor is to “know and act within your limits.” The members of RICS or, for that matter, any other professional valuation society, are reminded to “…be aware of the limits to your competence and don’t be tempted to work beyond these. Never commit to more that you can deliver.” The above applies to the methods the valuers use, and the level of confidence in the results they produce using these methods.
It is not unusual to see simplified methods of the cost approach used in a mass appraisal or valuation of an extensive list of assets: professional valuers call it ‘trending and bending.’ It is a shortcut used to arrive at the replacement cost of market value by indexing the historical cost of the assets based on data in the asset register. The use of indexing may be justified if the client’s historical costs are the best indication of value at some point in the past, or it could be the last resort of a valuer when individual asset records cannot be properly identified. It may be an expedient alternative when individual assets are immaterial, and the client does not see value in paying for a cumbersome but irrelevant analysis. On the other hand indexing can be fraught with danger when a significant line item (or a number of line items with a high relative cumulative cost cannot be identified and therefore an appropriate index cannot be applied.
This paper argues that while deceptively simple, bending and trending may become a shortcut that seriously miscalculates cost and therefore by definition, miscalculates value.
The starting point for the cost approach is the calculation of “current replacement cost”. Valuation of a single item or even a limited number of items might commence with a careful calculation of cost including all front-end soft costs1 as well as hardware cost and installation cost. Or larger plants the soft costs would include financing costs or foregone profit as mentioned in IVS2020 “Cost Considerations” para 70.12 and 70.132.
When dealing with complex plants, valuers may be required to put a number on thousands or at times, hundreds of thousands of assets. Methodologies establishing current replacement cost for such large inventories generally revolve around a form of “trend and bend” and sometimes the use of statistical sampling.
“Trend and Bend” refers to the practice of indexing historic (acquisition) costs as shown on an accounting or taxation asset register to current replacement cost new and then applying relevant adjustments to account for depreciation and obsolescence, usually using mathematical formulas to the derived “cost” to arrive at a value.
The idea behind the trending methodology is that the initial records are the most reliable indication of the acquisition or construction cost, hence if we know them and we apply certain trend indices to them, we can obtain equivalent replacement cost as of the valuation date.
IVS2020 para 70.14 endorses application of indexing when using the cost approach. See:
70.14. The actual costs incurred in creating the subject asset (or a comparable reference asset) may be available and provide a relevant indicator of the cost of the asset. However, adjustments may need to be made to reflect the following:
(a) cost fluctuations between the date on which this cost was incurred and the valuation date, and
(b) any atypical or exceptional costs, or savings, that are reflected in the cost data but that would not arise in creating an equivalent.
Whether the above inference is true is, however, a big question, that should be asked and tested every time a valuation is performed using “bending and trending” of historical costs.
The results of a trend and bend exercise can be seriously compromised if a number of factors are disregarded
- Materiality
- Accuracy of the asset register
- Exchange rates at the date of acquisition and date of valuation
- Whether original installation was carried out by labor, owner’s labor or international supplier’s labor
- Were assets new on the acquisition?
- Whether were assets capitalized at residual value under lease or other financial instrument
- Are the trends we apply correct and appropriate?
The above is not in any particular order; however a good starting point is to start with the reliability and accuracy of the source document: it stands to reason that if the asset register/depreciation schedule is inaccurate, the resulting valuation will similarly be inaccurate. Asset registers are often not accurate for a range of common reasons, not to mention issues unique to the subject entity. Issues that commonly occur are:
1. Assets capitalized at residual value under a finance document
2. Assets partly brought to account by external purchase and partly by expensing in-house labor
3. Data entry errors such as capitalization of the net value of an asset after a “trade-in” allowance, capitalization of large volumes of assets under a single line entry
4. The capitalization of upgrades to existing plant: this might include the replacement of plant components such as the replacement of analog controls with digital controls or even the replacement of discrete machines within a production plant.
At the commencement of the trending exercise, and any valuation assignment for that matter, it is essential to reconcile the assets of greatest value back to the asset register/depreciation schedule to ensure that all have been captured. Equally, it is important to confirm that the assets listed on the asset register/depreciation schedule are extant.
Once established that the asset register correctly lists all assets, or otherwise, the assessment of the relative materiality of individual items is the next logical step. Typically an inventory of assets follows a variation of the 80:20 rule. That is, 80% of value is reflected in 20% of the assets by count. On occasion the rule might turn out to be as high as 95:5 and occasionally slip below 80:20.
The treatment of the “80%” of assets is generally not material in the context of increasing the degree of error at the bottom line of the valuation, therefore, other comments in this paper do not apply to the majority of assets. A simple application of appropriate local indices (cost of production or imported goods indices might adequate) for cost increases since acquisition will provide a current replacement cost that is adequate for purpose.
It should be noted that most times the collective error of the less important items is immaterial, but individual items may be many times overstated or understated. It is difficult to test whether this has occurred without heading back to a line by line valuation. It is the experience of these writers that while individual values of lesser assets may be misstated, “unders” and “overs” tend to cancel each out.
In order to satisfy auditors and regulators, it is important to make statements within the report to cover this eventuality. Simply stated, for every “over” there is likely to be an equal “under”. To arrive at the threshold value for assets, which will be regarded as being in the “20%” by count, it is these authors’ view that the calculation should be carried out using historical cost as the indicator rather than Written Down Value3 (WDV). This is because WDV will generally see a significant number of assets at nil value. This will skew the calculation significantly more than using historical cost. It is recognized that relatively older purchases will represent a smaller percentage of the total than current cost might do however the reason this calculation is being carried out is for the very reason that we do not know current replacement cost. This is why it is important to cross-check that the major assets on the asset register are extant and that all major assets on the factory floor are within the “80%”.
When one turns to the 20% of material assets, it is important to carry out some check of current replacement cost against the indexed cost. A random check of the highest value assets will soon determine if there is misreporting of assets ab initio, use of incorrect indices or exchange rates or some other issue.
The variation in exchange rates and inflation over time are probably the two factors that can most significantly affect the bottom line of the valuation. An attempt to trend and bend the gross book value of equipment with prices set in the markets in the currency different the domicile is likely to result in a significant under of overstatement. The significance of the exchange rate impact is illustrated in the chart below.
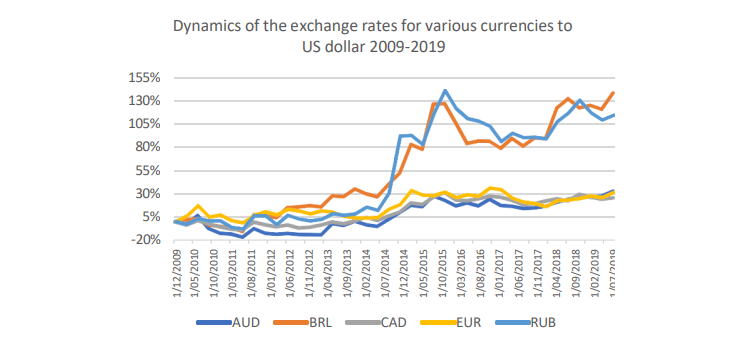
To maintain consistency, it is necessary to index the derived cost in the country of origin using the country of origin’s manufacturers’ price index. It should be self-evident that to use the resident country’s indices would distort the final result.
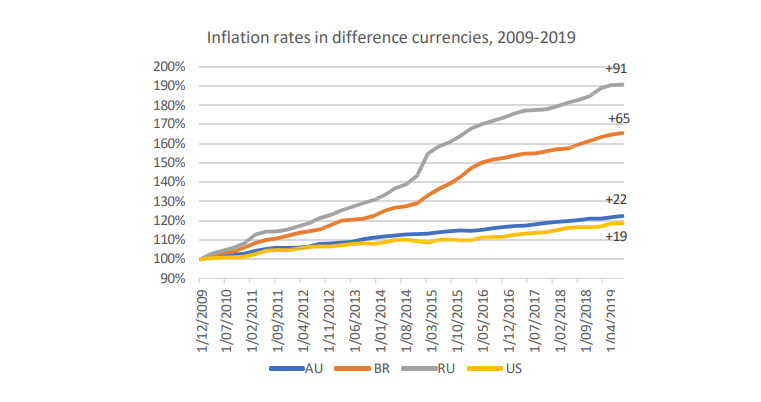
The impact of the inflation rate in different currencies is illustrated on the chart above. As can be seen, the inflation rates vary over time and are materially different for the developed and the emerging markets currencies, making trending and bending particularly challenging in a higher inflation rate environment.
The above highlights the importance of proper due diligence to ascertain whether the historic cost includes local labor or imported suppliers’ labor or whether labor has been expensed because it has been carried out in-house. If domestic labor has been used to install a given plant then before indexing the imported cost of the hardware, the cost of that labor must be separated from the hardware cost. Valuers will need to research the appropriate percentage to allocate to equipment and labor to not distort the result. The following illustration provides an allocation of the replacement cost in local currency and USD or Euro in the emerging markets using specific asset-heavy industries as an example.
| Industry | Construction and equipment installation costs, % of total costs | Locally produced equipment, % of total costs | Imported equipment, % of total costs |
| Upstream, Oil | 70% | 15% | 15% |
| Downstream, Oil | 60% | 20% | 20% |
| Power | 50% | 40% | 10% |
| Steel | 50% | 10% | 40% |
| Mining | 15% | 35% | 35% |
When valuing very large inventories the only alternative to trending and bending is the use of a sampling approach. When using a sampling technique, not every asset on the asset register is valued, however, the value of the assets can be expanded to represent the value of the whole inventory. When this is done in a rigorous scientific fashion this process of expansion is known as weighting. If a probability sample design is used and the assets are selected randomly then we may also assess how confident we are in the estimates of total valuation.
Understanding the historical trends in construction costs over time is critically important for asset-heavy industries, such as upstream and downstream oil and gas industries, petrochemicals and chemical process industries. There are various indices that are used for projects cost estimation and comparison of plant construction costs in these industries, including the Chemical Engineering Plant Cost Index (CEPCI)4, the Marshall & Swift index5, the Nelson-Farrar index (maintained until 2017)6, Upstream Capital Costs Index (UCCI) and Downstream Capital Costs Index (DCCI) published by IHS-Markit7 and illustrated on the chart below, and others industry indices.
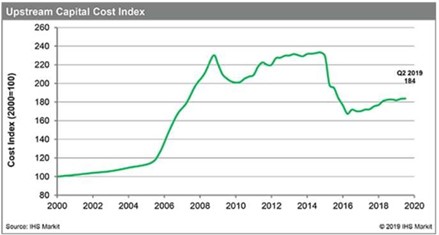
The indices provide customized sets of dimensionless numbers that compare prices of a class of goods or services to the corresponding prices at a base period using the following relationship between costs in indices.

The indices may provide details on the various relevant cost elements. The Nelson-Farrar index would usually report separately costs evolution for the following categories.
- Pumps, compressors, etc.
- Internal combustion engines
- Heat exchangers
- Materials
- Electrical machinery
- Instruments
- Miscellaneous equipment, average
- Labor
Care should be taken to make sure that the indices that were mostly developed for the US or some specific geographical markets apply in your specific situation. Another challenge when applying the industry cost indices is in the correct reconciliation of the subject assets and the units to which the indices apply, since the indices are cost indices, and not book value indices.
Once an indexed cost price has been established in the country of origin it is converted at the exchange rate at the date of valuation.
It is not unusual that the main plant and machinery is purchased from an overseas supplier but installed using local labor. Installation may have been supplied in-house and expensed (Opex) or provided externally and capitalized (Capex). The choice of scenario will have a significant impact on current replacement cost if the total historical cost is indexed as if the entire purchase was sourced from the country of manufacture.
Valuers and appraisers will know that even basic machinery can sometimes have an installation cost equal to the equipment cost or even higher.
As part of initial due diligence, it is important to establish if the “historical cost” shown on the asset register/depreciation schedule was for new equipment, used equipment or capitalization of equipment at a residual value at the end of a financing arrangement. If the stated historical cost was not for new equipment, then it is incumbent to identify that fact and resort to an appropriate bend and trend methodology for it.
Valuers and appraisers should be aware of a trend, at least in Australia and some other countries, to substitute historical cost with a value derived from a valuation. This phenomenon is regularly found in government accounts and also in companies where there has been acquisition and assets have been revalued for accounting and/or taxation purposes.
Sampling error arises as not every asset in the inventory has been valued. Therefore, the estimate of total value may not be identical to the total estimate of value if all assets were valued. This type of error can be estimated using the results of the valuation. One commonly used measure of the likely difference between a sample survey valuation and a complete valuation is the standard error8.
The major assets of a business being those items of high monetary value relative to all the other are identified, isolated and valued separately. Major assets are normally defined as beyond a threshold value which will often be determined in consultation with the client. A useful guide is 80:20 rules discussed above. Assets within the >80% of value category will each be valued individually thus presumably deriving the most reliable value. The exclusion of material of high monetary value as a separate category tends to ensure the homogeneity of other assets, which will then be valued within a stratified sampling process.
Provided this leads to a satisfactory RSE, which relates to the achievable level of materiality defined by the use of the valuation and the requirements of the client, the sample values will be projected to estimates of total value within each category using number-raised estimation methodology. The category level estimates will be calculated by multiplying the total value of the sampled assets by the ratio of the total number of assets in that category to the number of assets valued in the sample.
In conclusion
When the only problem-solving tool is a hammer, as the saying goes, all problems look like nails. When confronted with a situation where trending and bending is appropriate it could be a solution. However, as we tried to illustrate above the trending and bending hammer should be handled with care. Valuers need to know when it is appropriate to use trending, understand the limitations of this method and apply the procedures to sanity check the results.
1 Front end soft costs may include feasibility studies, environmental studies, government approvals, design fees, etc
2 IVS2020 [70.12.] An asset acquired from a third party would presumably reflect their costs associated with creating the asset as well as some form of profit margin to provide a return on their investment. As such, under bases of value that assume a hypothetical transaction, it may be appropriate to include an assumed profit margin on certain costs which can be expressed as a target profit, either a lump sum or a percentage return on cost or value. However, financing costs, if included, may already reflect participants' required return on capital deployed, so valuers should be cautious when including both financing costs and profit margins. [70.13.] When costs are derived from actual, quoted or estimated prices by third party suppliers or contractors, these costs will already include a third parties’ desired level of profit.
3 Written Down Value refers to value stated in the books of the business or on the taxation depreciation schedule after deduction from original cost for “depreciation”.
4 https://www.chemengonline.com/2019-cepci-updates-august-prelim-and-july-final/
5 www.marshallswift.com
6 https://www.ogj.com/home/article/17229698/nelsonfarrar-cost-indexes
7 https://ihsmarkit.com/Info/cera/ihsindexes/index.html
8 A related measure is the relative standard error (RSE) expressed as a percentage of the estimate of valuation. The RSE is a useful measure, particularly for comparison of accuracy between different categories and data items (e.g. value, number of items). The RSE also provides an immediate assessment of the relative accuracy of an estimate.